VISION
We explain in details the product flow of vegetables, potatoes and fruits from field to the end user. We make it clear who the four stake holders are of a DC. Also a survey of potential clients is given. Some important developments in the distribution as: loss of food world wide, increasing rapid urbanisation and the global growth of population are taken into consideration.
VISION
We explain in details the product flow of vegetables, potatoes and fruits from field to the end user. We make it clear who the four stake holders are of a DC. Also a survey of potential clients is given. Some important developments as: loss of food world wide, increasing rapid urbanisation and the global growth of population are taken into consideration.
The product flow
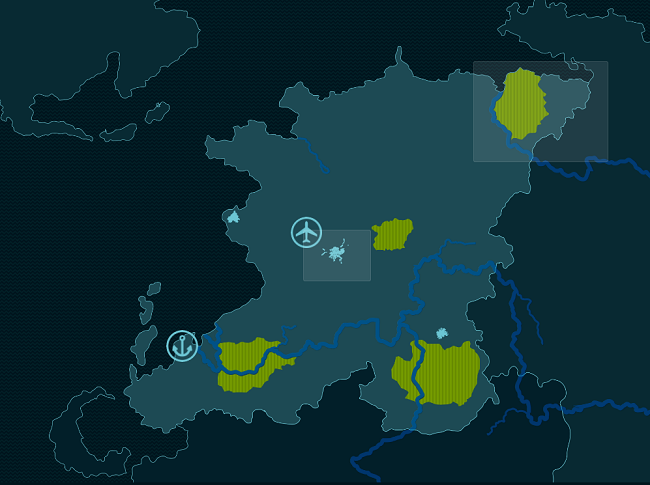
See the distribution of agriculture produce on attached interactive map.
This is a virtual country. In this virtual country all elements are included that can be found in most countries with relation to the vegetable distribution chain. The country has several areas where vegetables are grown, several larger and smaller cities, a harbor and an airport.
Increasing urbanization world wide
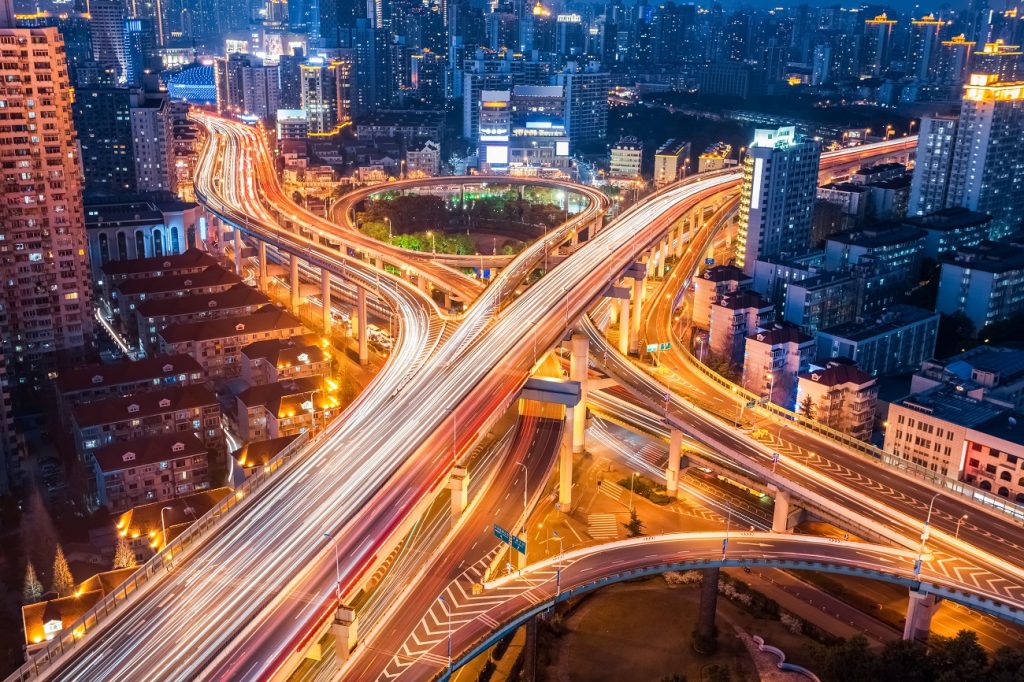
Distribution centres are vital to secure food supply to the cities. Special for fresh vegetables, potatoes and fruits.
Urbanization is going faster and faster.
- In 1800 only 2% of the populatie lived in cities.
- In 1950 this percentage increased till 30%.
- In 2030 it is to expected to be 60%.
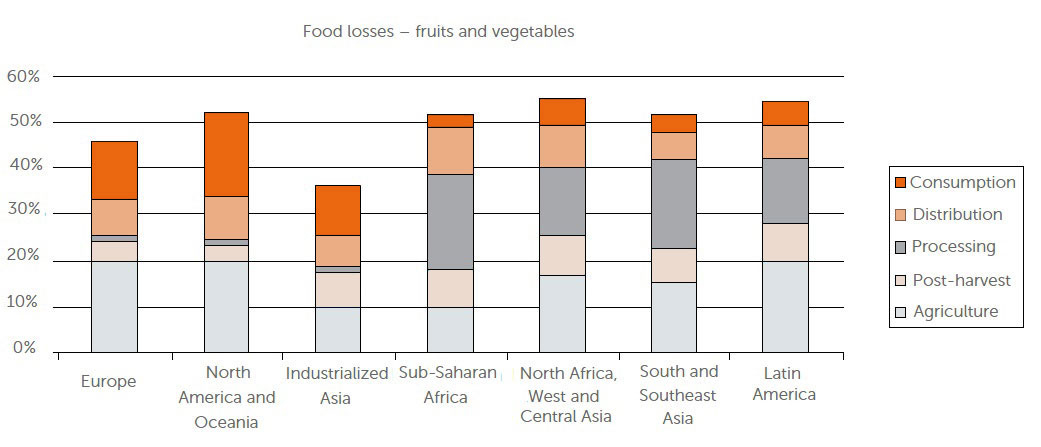
Global food losses
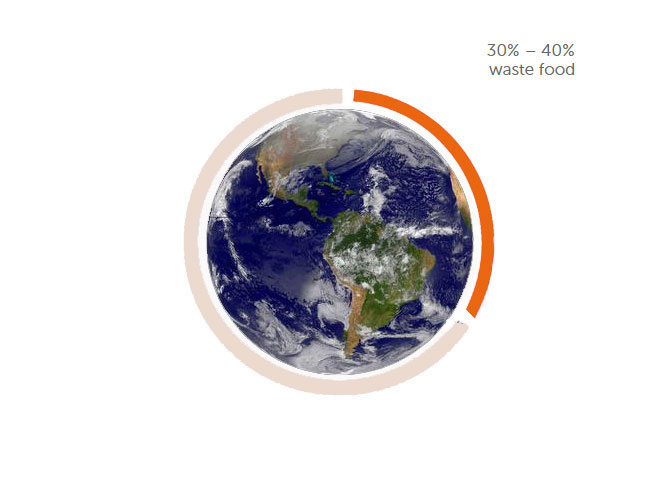
- Almost one-third of food produced for human consumption—approximately 1.3 billion tonnes per year, which could feed the total global population of 7 billion—is either lost or wasted.
- Overall food loss primarily occurs in the production to retail phase of the food chain.
- Consumers in industrialised nations waste significantly more food than their counterparts in developing countries.
- Post-harvest losses occur mainly due to corruption and meagre infrastructure in the developing world.
- Pre-harvest losses are another major factor in the developing world, as a result of insufficient investment in biosecurity practices.
- A voluntary platform for retailers to report food waste statistics and a less over-conservative system of setting use-by dates, would aid in combating waste.
- An increasing world population, and its progressively scarce resources, make reduction in food losses and waste a key component in any strategy for a sustainable future global food supply.
World Population
The chart above illustrates how world population has changed throughout history.
Wonder how big was the world’s population.
- During the 20th century alone, the population in the world has grown from 1.65 billion to 6 billion
- In 1970, there were roughly half as many people in the world as there are now.
- Because of declining growth rates, it will now take over 200 years to double again.
The potential clients of the distribution centres
Why to opt for a Dutch approach?
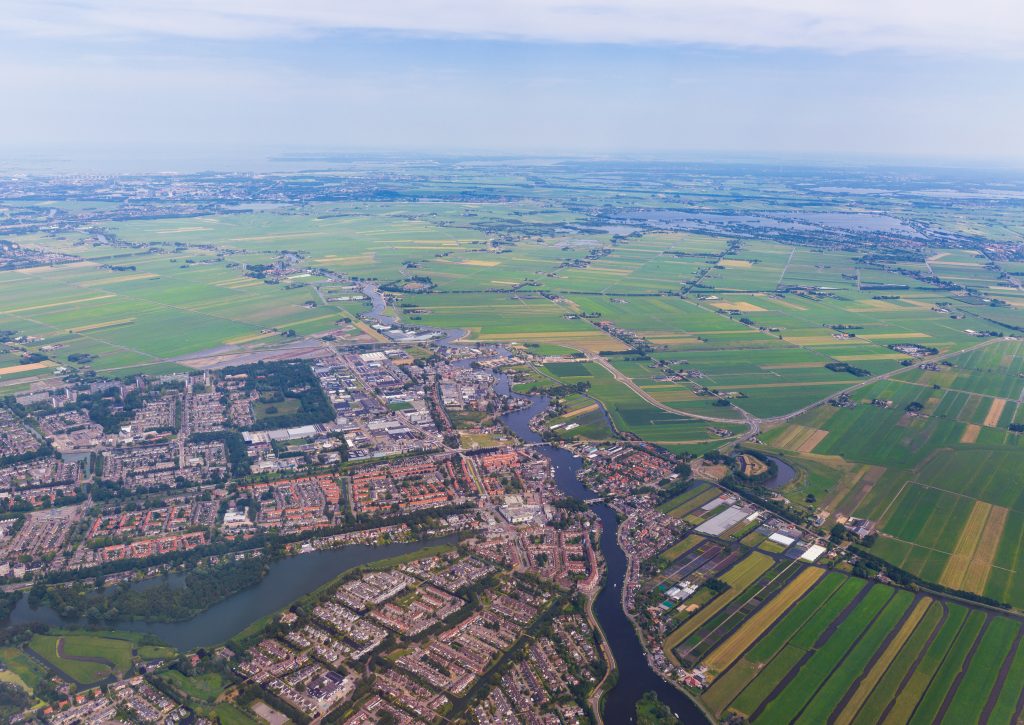
In Holland we have a total surface of 45.000 sq. kilometers and 17 million inhabitants. Despite being a small country we are the second largest exporter of agricultural products.


